- 日本語
- English
The S-255 model has the ability to speedily detect low level rub and buzz noise. The rub and buzz detection extracts noise elements by the subsequent mechanisms
(1) Noise is differentiated from the main signals by employing the fact that noise appears as high harmonic components of driving signals of speakers.
(2) noise is removed by adopting the idea that rub and buzz noise is composed of constituents that have correlation with driving signals. The combination makes the tool exceptionally superior in detecting rub and buzz noise, and being noise resistant as well as verifying good/defective samples objectively. Thus ETANI has been promoting this ability for more than 20 years.
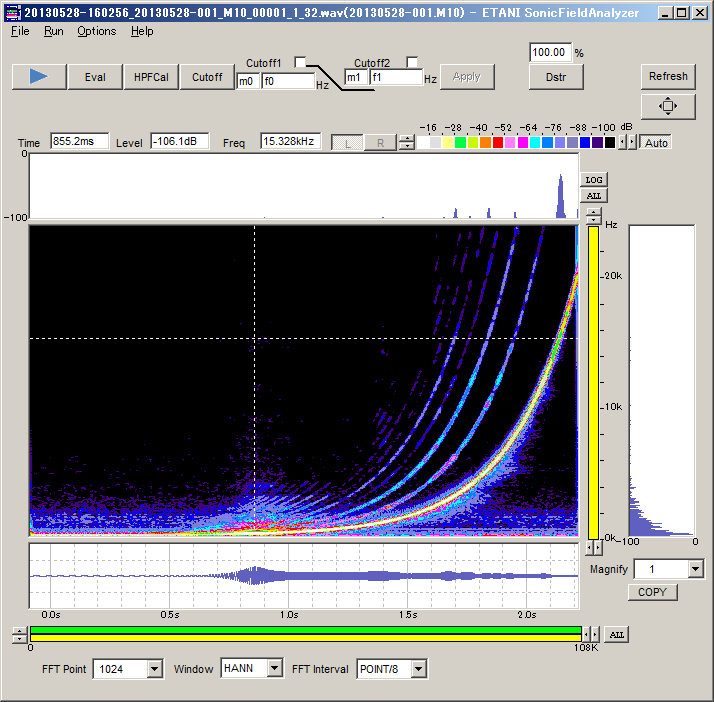
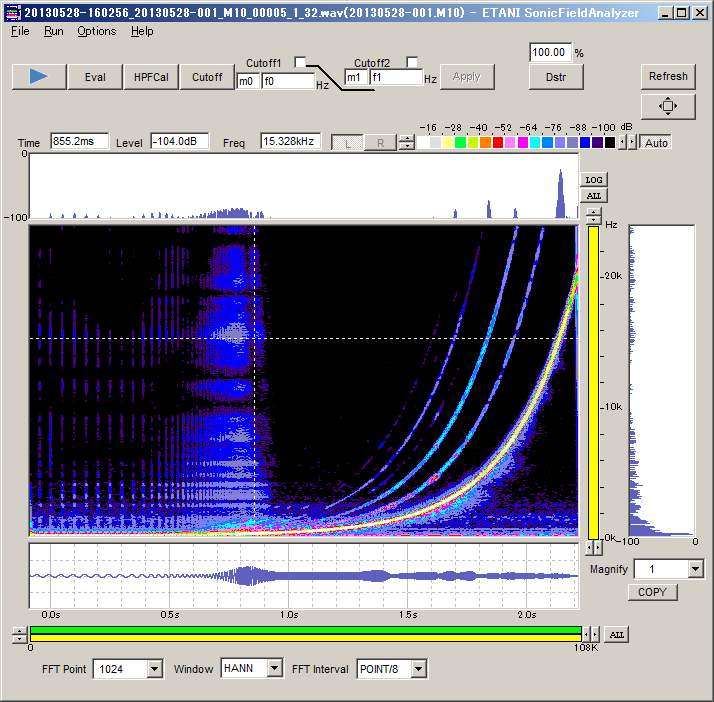
(2) is an automatic mechanism, so there is no need to set up. But in (1), the harmonic distortion that occurs in normal speakers, and the high harmonic components generated by rub and buzz, are separated by a high pass filter with a cutoff frequency that varies according to the fundamental wave and tracking.
Therefore, how effectively the high pass filter is set up in order to differentiate the rub and buzz noise, becomes the key to utilizing this tool.
Here, the Rub & Buzz Analysis Tool has been developed to observe this. It provides:
On the basis of analyzed results by Sonar Graph, you set up the cut-off frequency of high pass filter as follows:
Use the tool as follows: